|
PolicyMap© is a new, powerful, easy-to-use
online mapping service. Produced by The Reinvestment Fund (TRF) [website], a national leader in
the financing of neighborhood
revitalization, it shows economic and demographic data
through maps, tables and reports. PolicyMap offers simple and quick online
access to a wealth of data for anyone who needs it. From
city planners and grant makers to real estate developers
and strategic consultants, professionals can use it to
map and analyze information based on geography.
An email from an urban redevelopment
executive told me about PolicyMap.
So I registered (free)
for this online service. (Professional users will probably
want a paid subscription for access to all the data.)
Immediately available was a huge choice of
ways to could map an area: age, race, income,
education, vacancies, and much more. PM's website says
they offer 4,000 indicators. Many of them allow
examining changes and trends across the years.
Imagine picking a
location and a statistic, often selecting a year, and
zooming in and out, looking at maps, charts and reports.
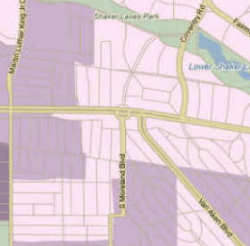
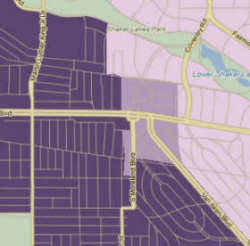
For a taste of what I
found, I've saved
images of two PolicyMap pages on timely topics on this site, so there's no
need for you to register. Click on the images below
to
display much larger images with a legend.
|
|
If you are interested in the urban landscape, take a good look at PolicyMap's
online mapping tools. Geographical Information
Systems (GIS) have been around for many years, but I can't
imagine them friendlier or more powerful than
PolicyMap.
Arnie Berger November, 2008
|