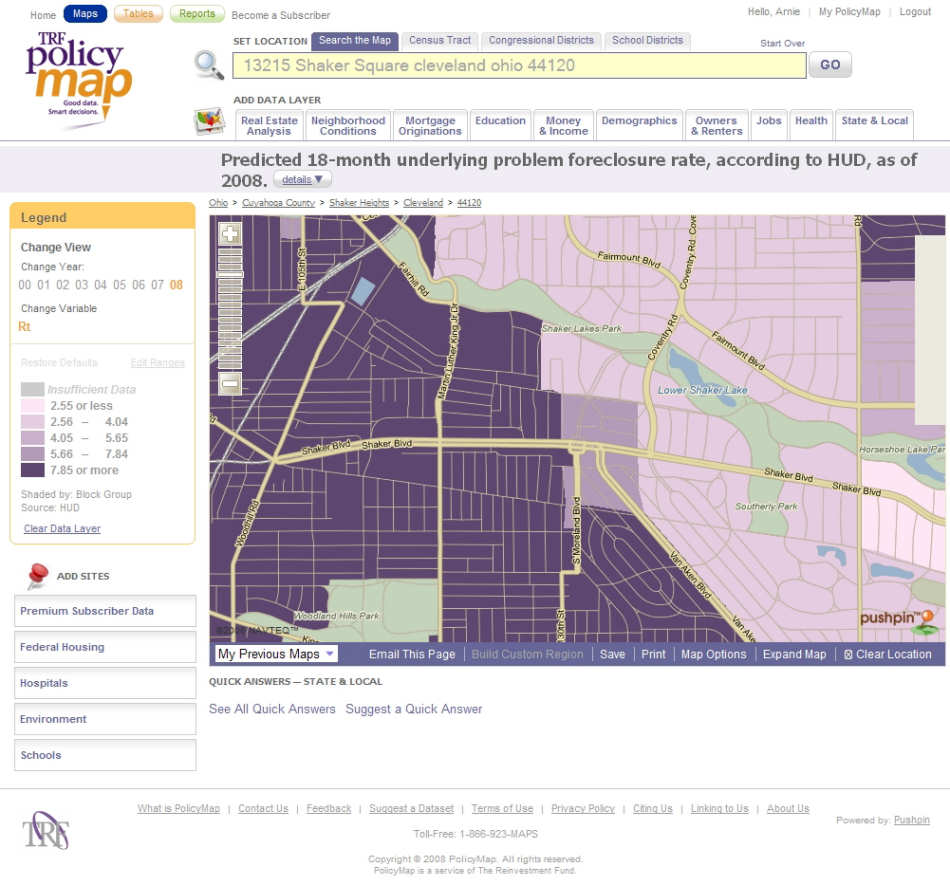
HUD's predicted 18-month underlying problem
foreclosure rate, as of 2008.
(as explained on PolicyMap)This rate
does not provide the actual level of foreclosures in an area, but
rather predicts what the foreclosure risk might be going forward. A
rate closer to 100 indicates that HUD's analysis suggests a very
high predicted risk, and a rate closer to 0 suggests a very low
predicted risk. These data were released by HUD through their
website to help grantees apply for the Neighborhood Stabilization
Program in keeping with the stipulations laid out in the Housing and
Economic Recovery Act of 2008. Grey shading in the map indicates
that either the data released by HUD did not include these areas or
that HUD gave these locations more than one rate. |